Equipment analytics
How many repairs there were, which defects occur most often and how many parts went out — across all equipment or one unit, for any period.
Filter
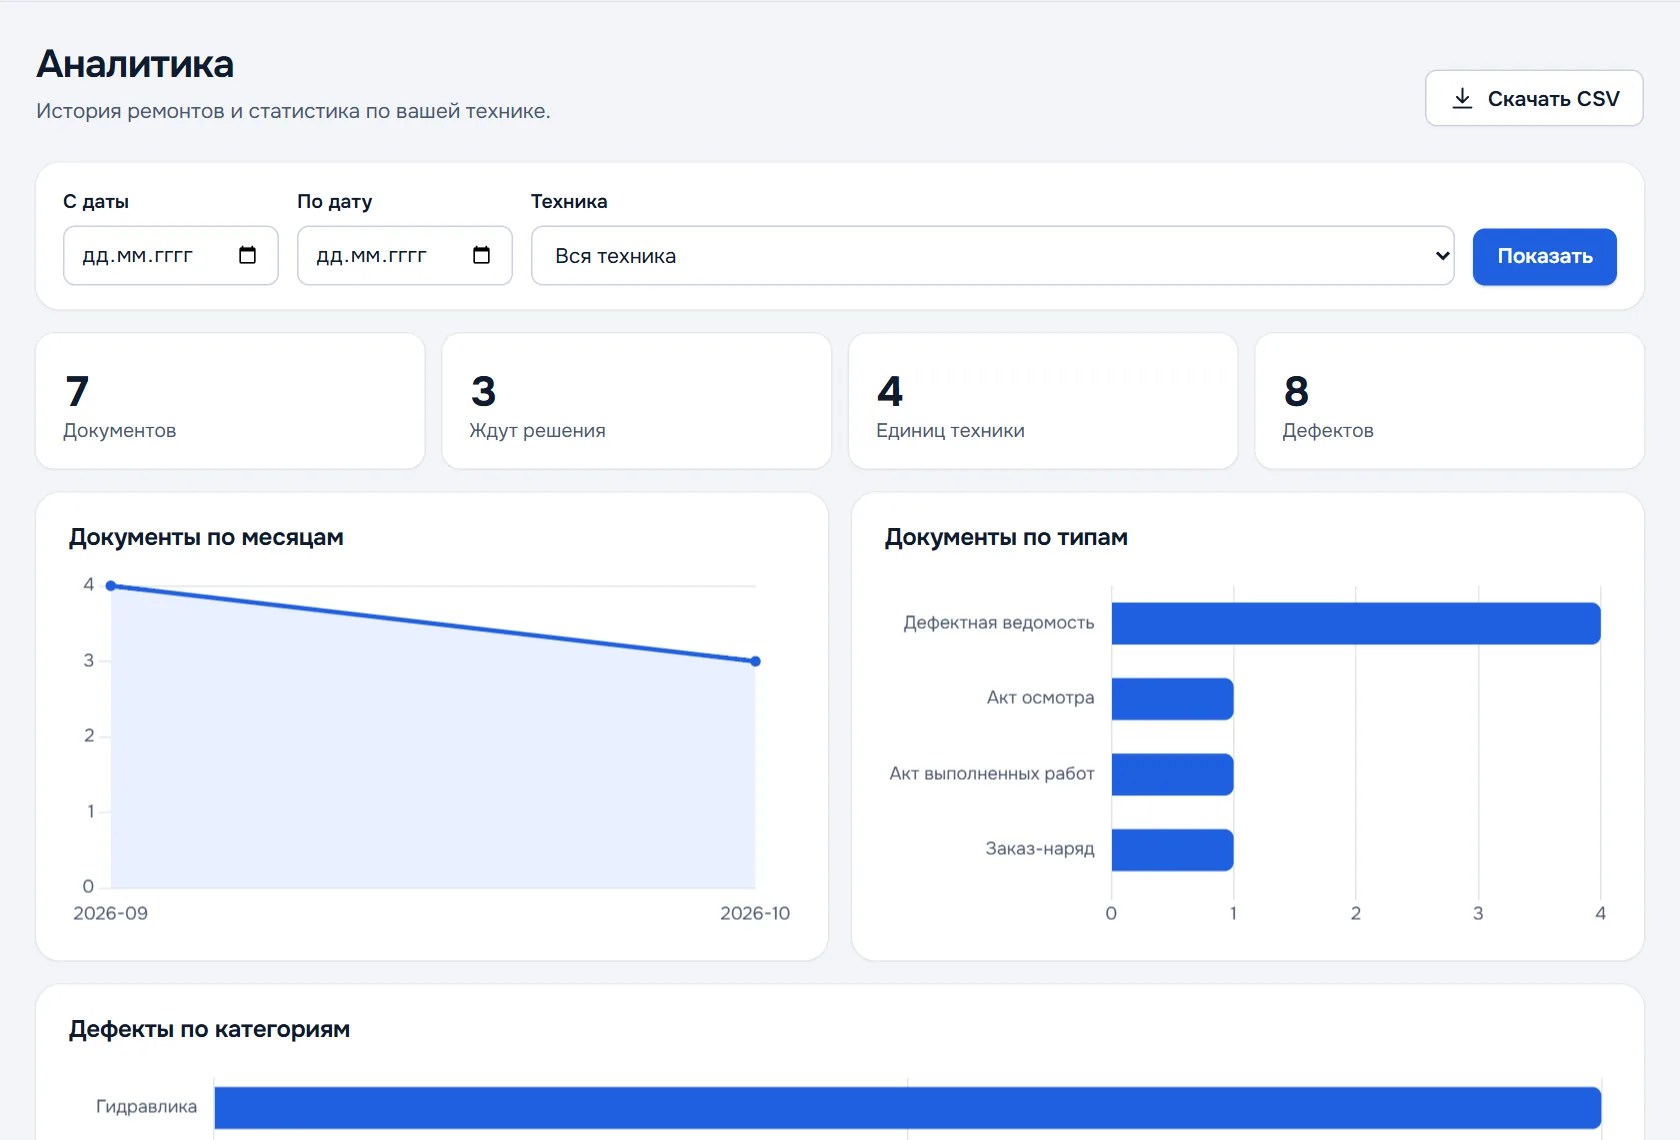
At the top of the Analytics section — the period (from and to) and the equipment: all of it or one unit. Press Show.
What it shows
- Totals — how many documents, how many await a decision, how many units of equipment and defects.
- Documents by month — how the number of repairs changed.
- Documents by type — reports, inspection acts, work orders, completion acts.
- Defects by category — where things break most: hydraulics, running gear, electrics and so on.
- Parts consumption — parts from estimates, tied to the contractor's catalogue.
- Repair history by equipment — choose a unit in the filter and all its documents appear here in order; a row opens the document.
Exporting
The Download CSV button exports the data for the chosen period — the file opens in Excel.